508 Resource Limit Is Reached: Find Which Limit You Hit in cPanel
Tested in a ShoHost sandbox on 12 October 2026: Apache 2.4.68 and PHP 8.4 on Debian, captured with headless Chrome. CloudLinux LVE isn’t available outside a licensed server, so we reproduced the Entry Processes (EP) limit with a small PHP gate that allows 3 requests at a time and returns HTTP 508 to the rest. The real CloudLinux page and the cPanel Resource Usage screens look different from ours. Every screenshot below is from that sandbox, not from a customer site.
508 Resource Limit Is Reached means your hosting account went over one of the per-account limits that CloudLinux puts on shared servers. The server is not down. Your account is being held back for a few seconds or minutes so it doesn’t slow down everyone else on that server. To fix it you need to know which limit you hit, because each one has a different cause.
What it looks like

The message usually reads “The website is temporarily unable to service your request as it exceeded resource limit. Please try again later.” It tends to come and go: the site works, then fails during a traffic spike or a bot crawl, then works again.
Step 1: Find which limit you hit in cPanel
Log in to cPanel and open Metrics → Resource Usage (CloudLinux LVE Manager). The overview says whether your account has hit limits recently. Open Details and look at the faults columns. A fault is one moment when the account was at its limit. The limits you’ll see are:
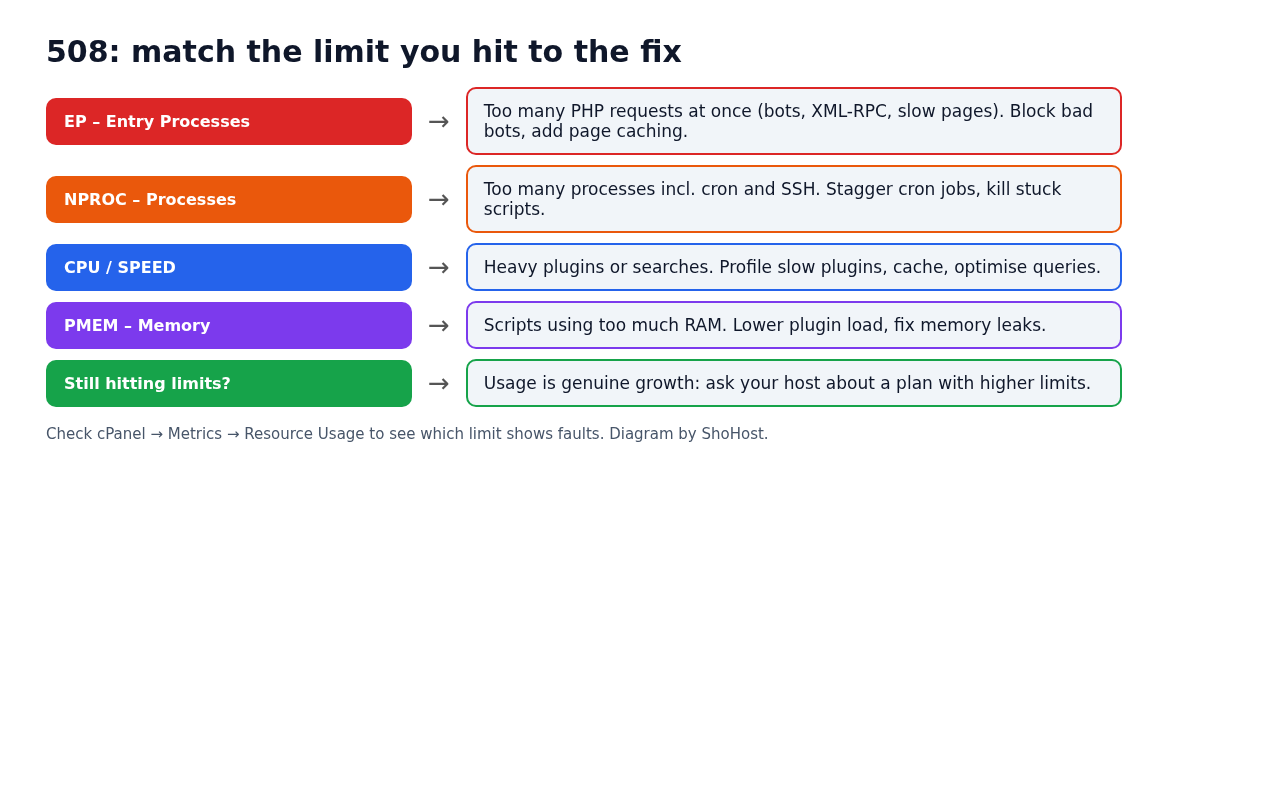
- EP (Entry Processes): how many PHP or CGI requests can run at the same moment. This is the usual cause of 508.
- NPROC (Number of Processes): every process in the account, including cron jobs, SSH sessions and mail scripts.
- SPEED / CPU: CPU time. When you hit it the site slows down, and that can push EP over its limit.
- PMEM (Physical Memory): RAM. Processes that go over it get killed, and you may see 503 or 500 errors as well.
- IO / IOPS: disk throughput. When you hit it, pages and backups slow down.
Step 2: Reproduce the pattern (what we saw in the lab)
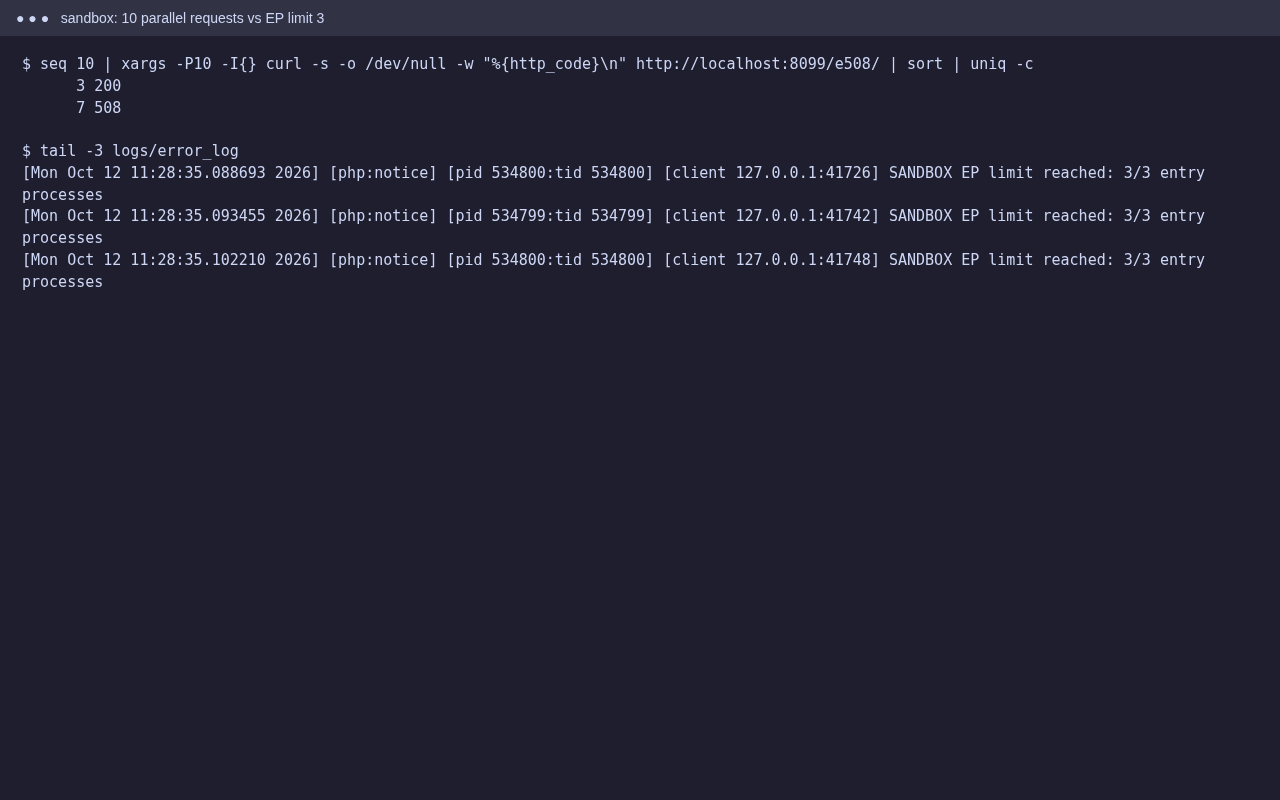
We sent 10 requests at once to a page that takes 1.5 seconds. With room for only 3 at a time, the other 7 got a 508 straight away. Bot traffic does the same thing to a real site: many slow uncached requests arrive at the same moment, every EP slot fills, and the next visitor gets the error page. You can run the same test on a staging copy of your own site:
seq 10 | xargs -P10 -I{} curl -s -o /dev/null -w "%{http_code}\n" https://staging.example.in/ | sort | uniq -cOnly run this against a site you own, and never against production during busy hours.
Step 3: Apply the fix for that limit
EP or NPROC faults
- Turn on page caching (LiteSpeed Cache on LiteSpeed servers) so most visits never start PHP.
- Check Metrics → Raw Access or Visitors for one IP or bot hitting the site again and again, especially
xmlrpc.php,wp-login.phpor?s=search URLs. Block it in Security → IP Blocker or through your CDN. - Space out cron jobs so they don’t all start at the same minute, and replace WP-Cron with a real cron job that runs every 5–15 minutes.
CPU or memory faults
- Deactivate plugins one at a time to find a heavy one (page builders with broken caches, stats plugins, broken-link checkers).
- Clean up the database: remove expired transients and old post revisions.
- Look at Metrics → Errors for scripts that time out or run out of memory.
Still hitting limits with clean traffic?
If the traffic is real visitors and the site is already cached, the account has outgrown its plan. Ask your host which limits your plan has, and move to one with more EP and memory.
FAQ
Is 508 the same as a 503?
No. 503 is a general “service unavailable” error. 508 on cPanel hosting almost always comes from CloudLinux account limits. A host can set up some limits to return 503 instead, so check Resource Usage for both.
Will the 508 go away on its own?
Usually it does once the burst of requests ends. If it keeps coming back, something is still using up the limit, and you need to find what it is.
Can I raise the limits myself?
Not on shared hosting. The host sets them per plan. What you can do is make each request cheaper with caching and by blocking bad bots.
Does a CDN help?
Yes. It serves cached pages and can block bots before they reach your account, which frees EP slots.
Need a hand?
Want someone to do this for you? If your site is on ShoHost, message our support team on WhatsApp at +91 94880 91432 or email [email protected] and we’ll look at the logs with you. Hosting somewhere else and running into resource limits often? ShoHost WordPress hosting runs on LiteSpeed servers with NVMe storage and free SSL, and includes free migration.